
🔍 57% Volatility on a Quiet Afternoon? Reading NIFTY's 27 October Expiry Minute by Minute
At 15:20 this afternoon, a NIFTY trader looking at a typical "ATM IV" readout would have seen 57%.
NIFTY moved less than 200 points from the day's low to the day's high. It closed within 50 points of where it opened. Nothing about the tape looked like a 57-vol market. By 15:28 the same readout had collapsed to 0.4%, a level that would make NIFTY the calmest asset on the planet.
Both numbers came from real option prices. Neither described what the options market was actually pricing.
This post walks through today's monthly expiry, minute by minute. It shows where the familiar ATM IV number stops describing the market and starts describing its own arithmetic. It ends with a simple test you can run on any screen: ask the call and the put at the same strike what volatility they imply, and see if they agree.
1. The setup: one session, two readings
We captured every NIFTY option strike, every minute, for today's session (27 October 2026, the October monthly expiry) and for the next weekly contract (3 November).
We then read implied volatility from those prices in two ways:
- The typical screen recipe. This is how many retail screens compute "ATM IV". Take the strike nearest the index and use the nearest expiry. Then price the option off the index level with a fixed interest rate (7% is common). It is the textbook formula, applied as written.
- The ALPresi measure. This is the volatility series our desk works from. It uses the same option prices from the same session.
Same data, same minutes. The only difference is how the prices are read.
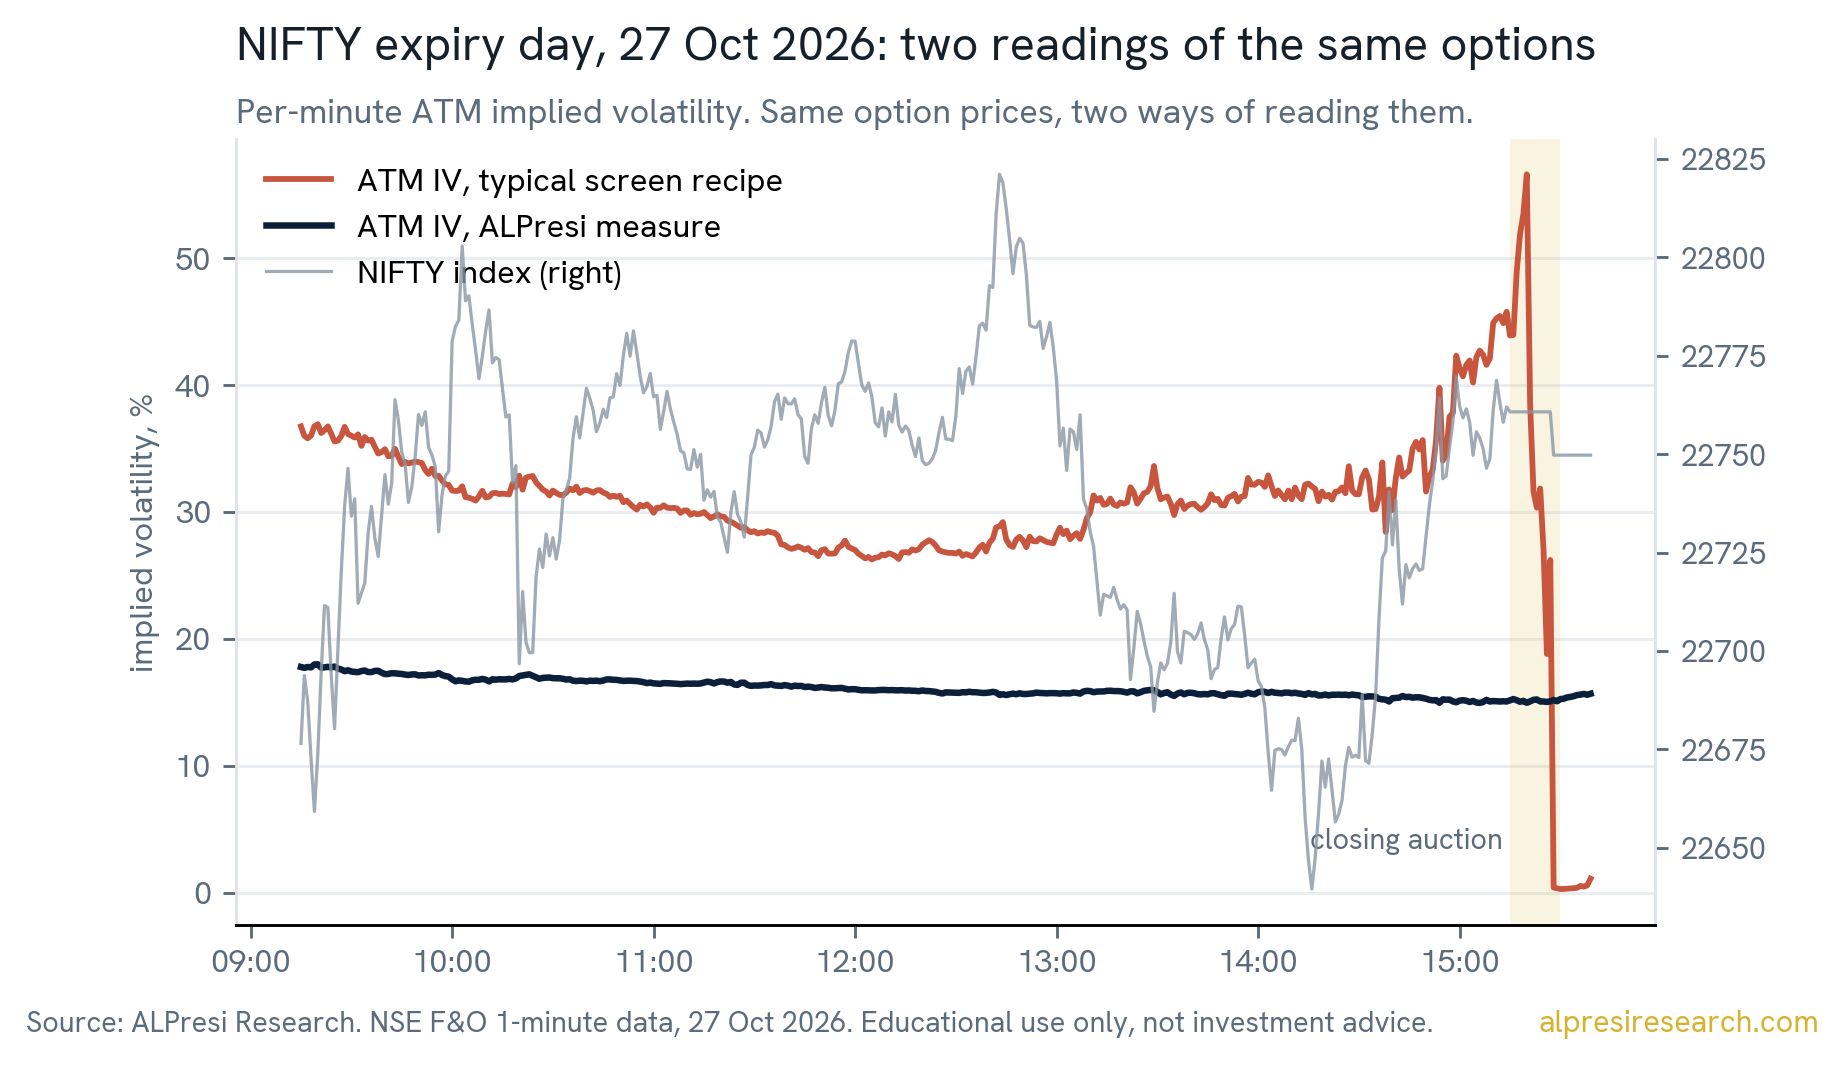
NIFTY expiry day ATM IV, typical screen recipe vs ALPresi measure
The two lines barely resemble each other:
| Time (IST) | Typical screen recipe | ALPresi measure |
|---|---|---|
| 09:20 | 36.9% | 18.0% |
| 13:00 | 28.2% | 15.7% |
| 15:00 | 41.3% | 15.2% |
| 15:20 | 56.6% | 15.0% |
| 15:28 | 0.4% | 15.2% |
| Day range | 0.3% to 56.6% | 15.0% to 18.0% |
One line spends the day drifting between 15% and 18%. That is what a calm, range-bound NIFTY session looks like. The other starts near 37%, sags through lunch, then climbs into the close before falling off a cliff.
Screens differ in the small details, such as exactly when they treat the contract as expired. Depending on the screen, the 15:20 reading came out anywhere from about 40% to nearly 60%. The shape was the same everywhere: a climb into the auction, then a collapse towards zero.
2. Why the screen number climbs into the close
On expiry day, the nearest contract is dying. By 15:00 it has well under an hour of life left. By 15:20 it has minutes.
An option with minutes to live has almost no time value left. Its price is mostly intrinsic value plus a few rupees of "maybe". Feed that tiny remaining premium into a volatility formula, and the formula has to divide by an equally tiny amount of time. A one-rupee wobble in the option price is perfectly normal noise in the last minutes. Here it becomes a double-digit swing in "volatility".
So the climb you see after 14:30 is not traders bidding up volatility. It is a measurement running out of denominator.
The Denominator Problem (\(T \to 0\))
In the Black-Scholes model, implied volatility scales by \(\frac{1}{\sqrt{T}}\). As the expiration clock ticks down to minutes:
The denominator (\(\sqrt{T}\)) approaches absolute zero.
Any tiny, routine 0.50 or 1.00 rupee bid-ask bounce in the option premium gets amplified by this massive denominator decay.
The result: The calculation blows up exponentially, spitting out a meaningless 57% IV on a quiet day, followed by a sudden collapse to 0.4% the second the contract clears
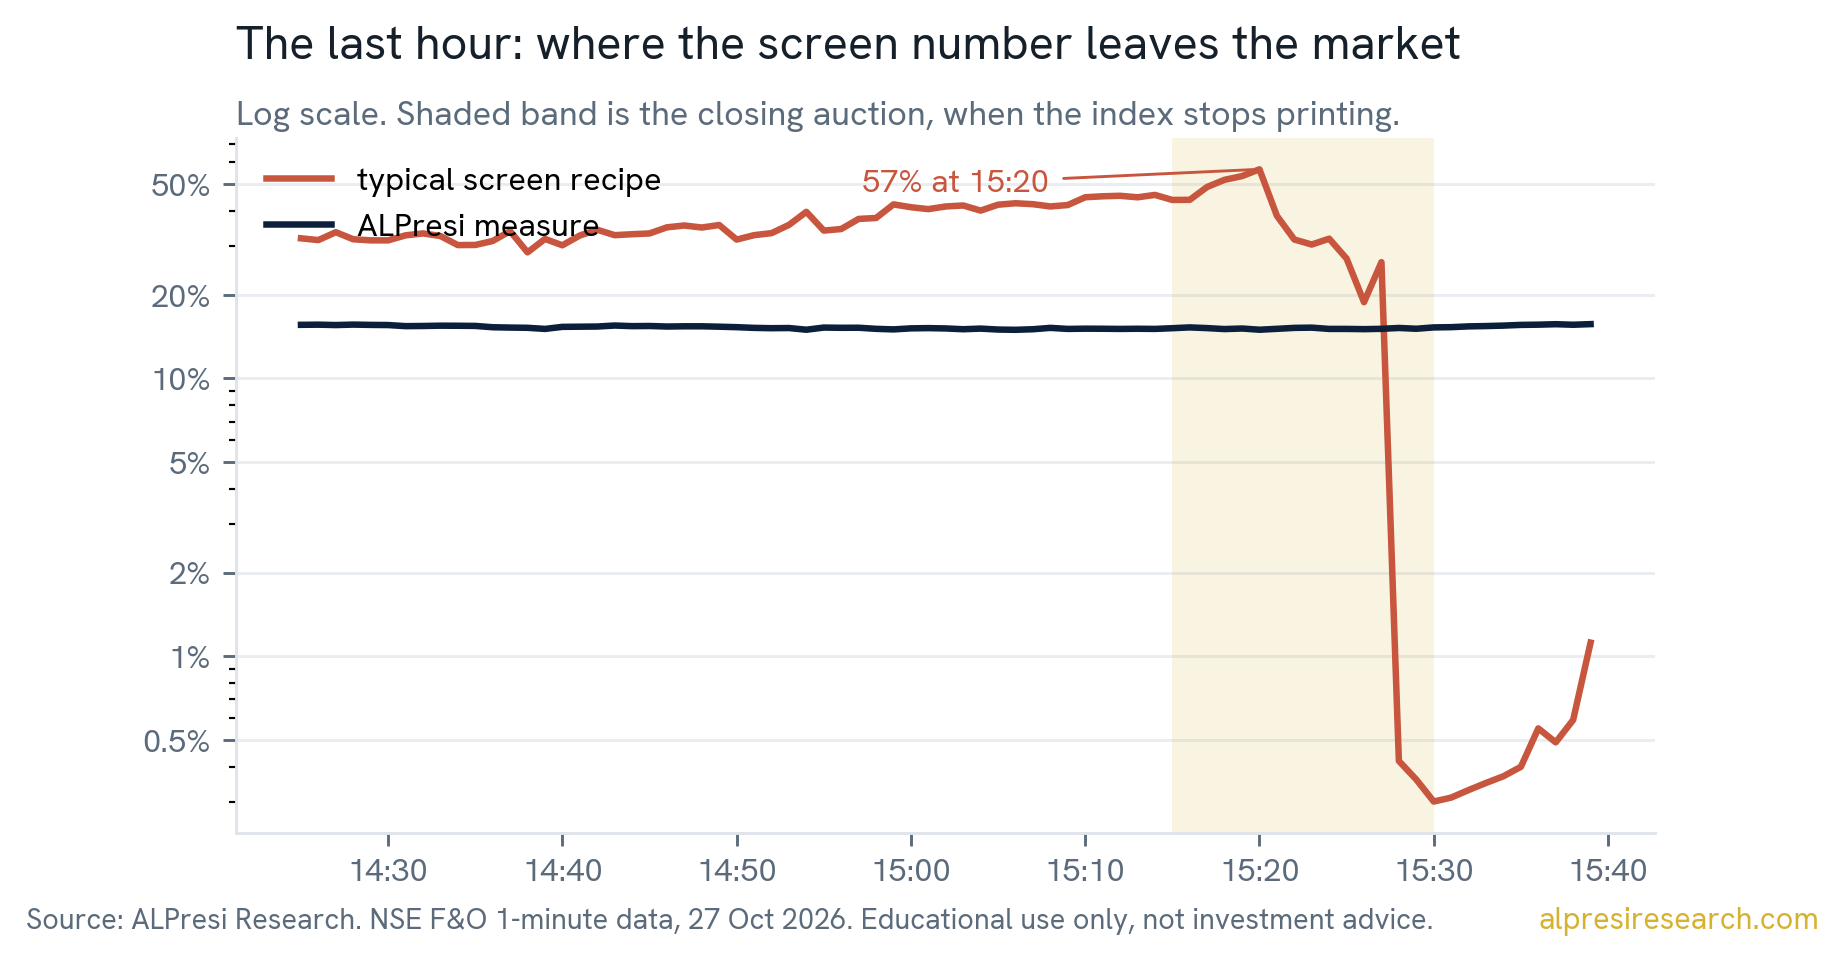
The last hour on a log scale
On a log scale the shape is even clearer. The screen recipe rises from about 35% to 57% while the ALPresi measure sits flat around 15%. Then the index re-prints at the settlement level, and the screen number does not just fall. It drops to 0.4%.
Neither 57% nor 0.4% was ever a price anyone could trade. They are artefacts of asking a dying contract a question it can no longer answer.
3. The 15:15 problem: the index stops, the options don't
There is a second, quieter effect hiding in the same window.
Since the closing auction session came in, the cash market runs continuous trading only until 15:15. From 15:15 to roughly 15:28 the index does not print a new value. Today NIFTY sat at 22,760.75 from 15:15 through 15:27, then jumped to the settlement value of 22,749.75.
The options did not stop. They kept trading, and they kept repricing where they thought the auction would land.
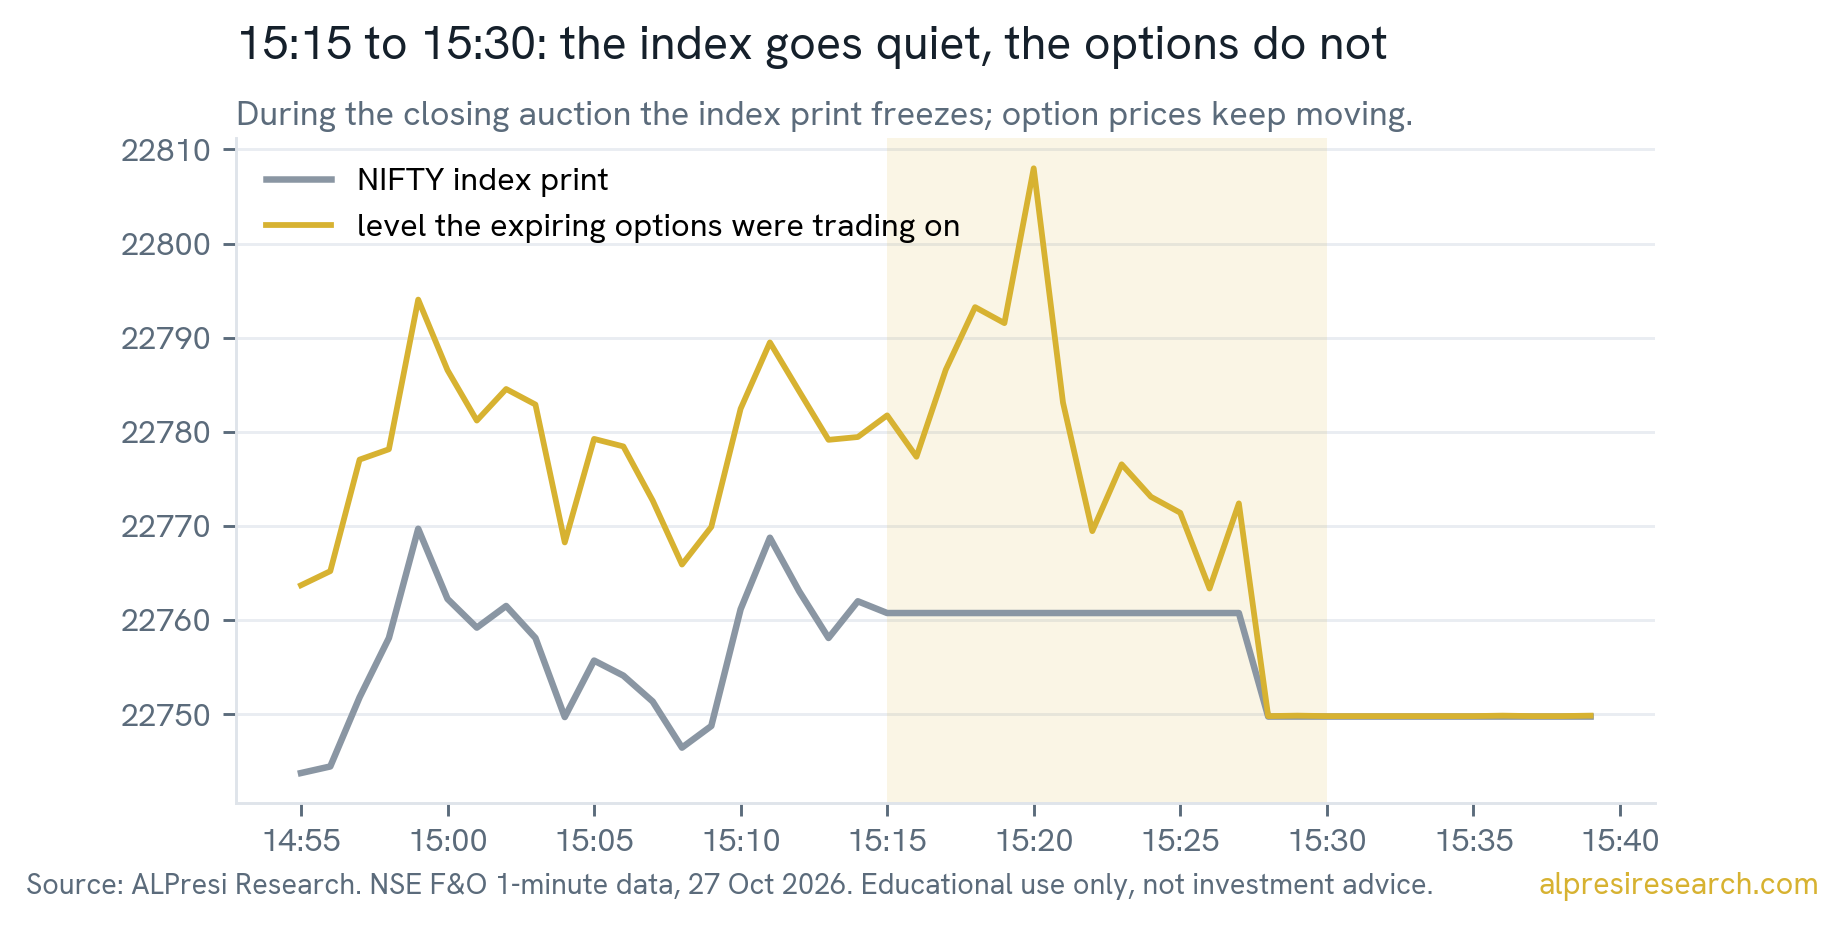
Index print vs the level the expiring options were trading on
The grey line is the index print, flat as a table. The gold line is the level the expiring options were actually trading on, minute by minute. At 15:20 it reached 22,808, 47 points above the frozen print. It then converged onto the settlement value at 15:28.
Any volatility number anchored to the index print is, for those minutes, using a stale value while the options price something else. On a normal day that adds noise. On expiry day, with minutes to go, a 50-point gap is enough on its own to throw the number around by tens of vols. That gap is between where the formula thinks the market is and where the options are trading.
So the screen line has two reasons to go wild inside the shaded band. The first is time running out. The second is the anchor going stale exactly when it matters most.
4. The call/put test: one strike must give one IV
There is a check that needs no opinion about what volatility "should" be.
A call and a put on the same strike and the same expiry are tied together by put-call parity. Buying the call and selling the put at one strike is the same position as owning the underlying at that strike. Arbitrage keeps it that way. Because the two options are locked together, they must imply the same volatility. If a formula gives one IV for the call and a different one for the put at the same strike and the same minute, the market is not the problem. The formula's inputs are.
So we ran the test on the 22,800 strike of today's expiring contract, at or next to the money for most of the session.
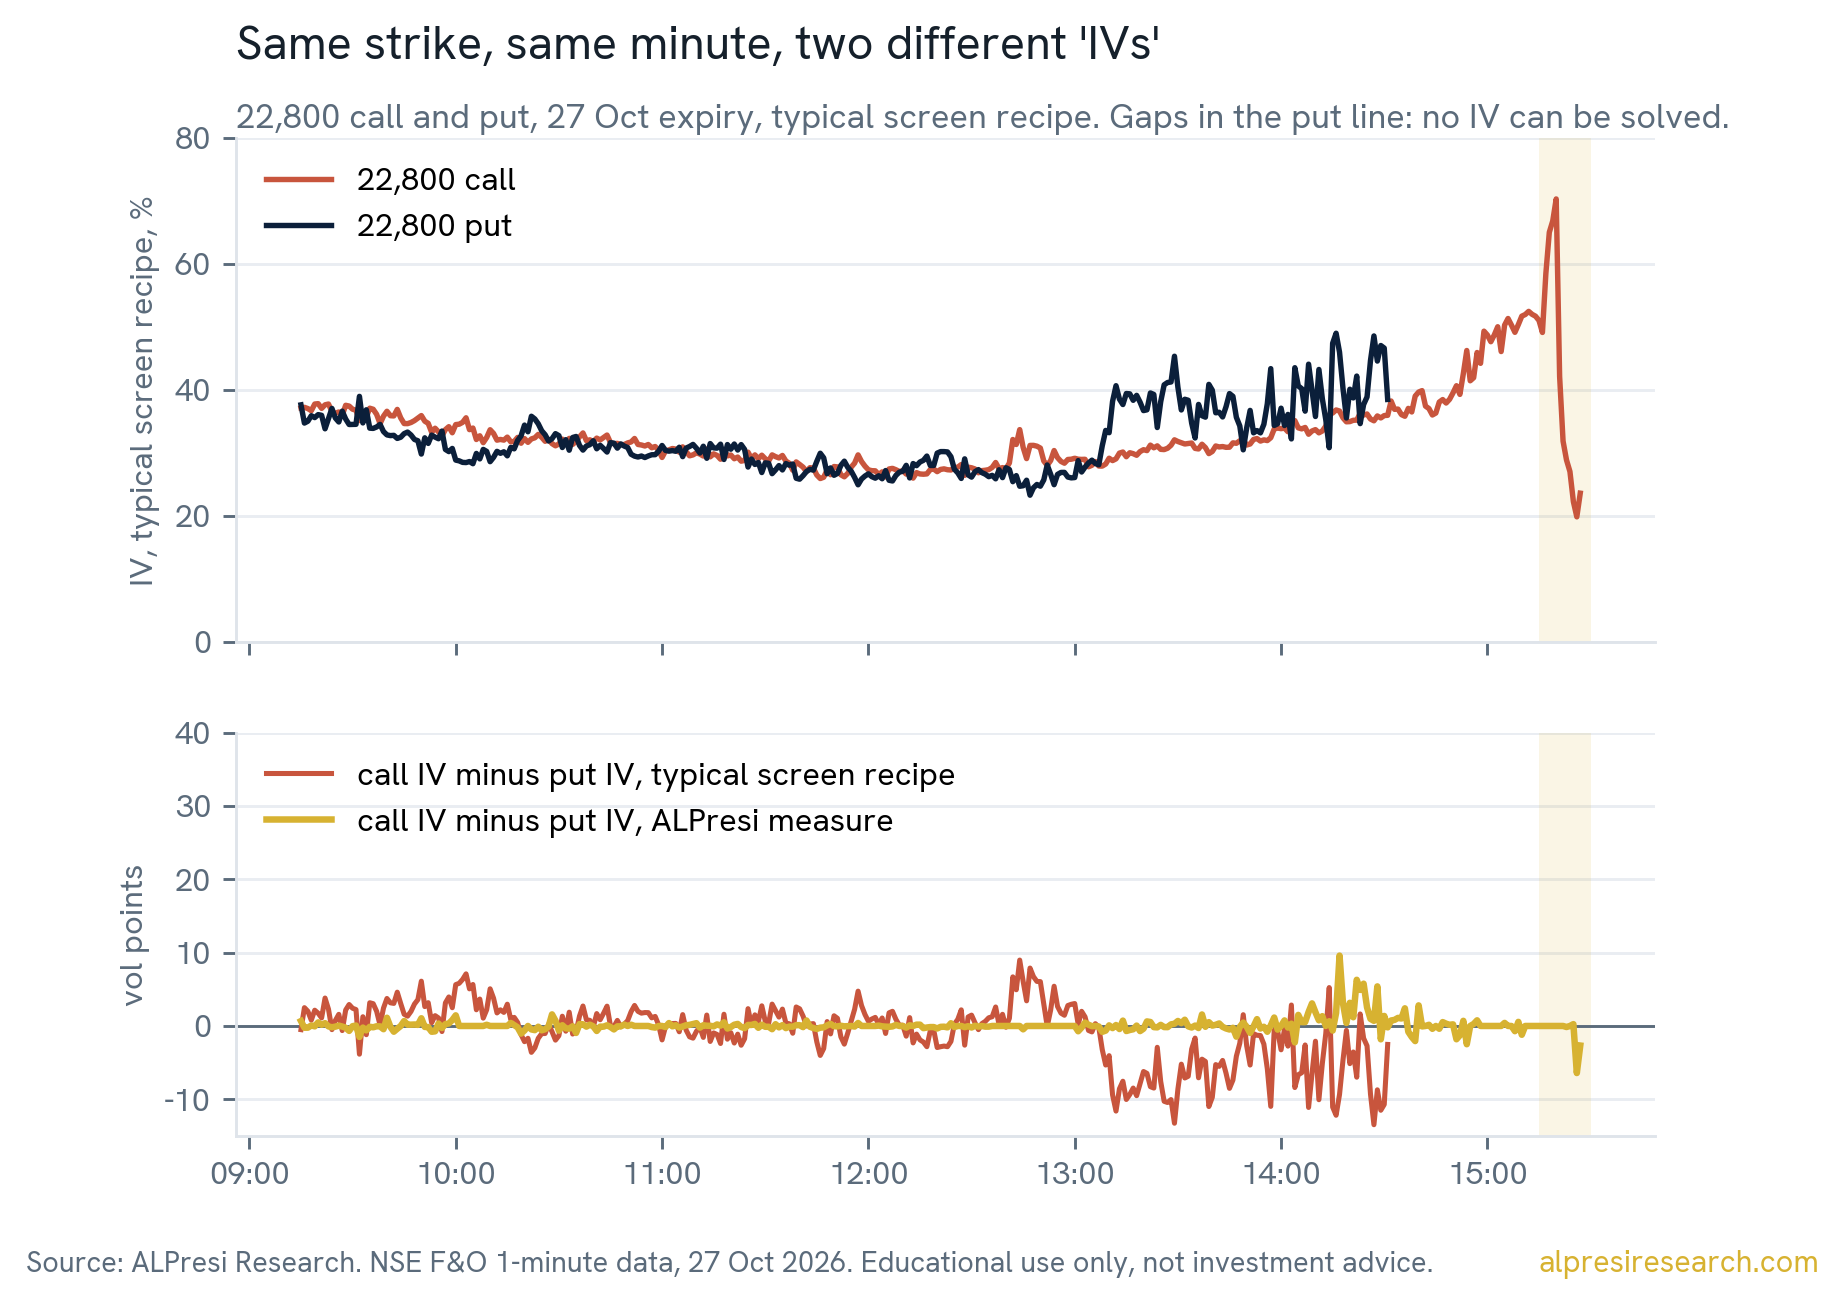
22,800 call and put IV, same strike, same minute
The top panel is the typical screen recipe. The call and the put should be one line. They are not:
| Time (IST) | 22,800 call IV | 22,800 put IV | Gap |
|---|---|---|---|
| 10:00 | 34.5% | 28.9% | 5.6 points |
| 12:45 | 30.9% | 24.8% | 6.1 points |
| 14:00 | 33.9% | 37.1% | 3.2 points the other way |
| 15:10 | 51.7% | no answer | the put's IV cannot be computed |
Up to 14:30 the screen recipe's call and put disagreed by 3.0 vol points on average, and by as much as 13.5 points in a single minute. The sign flipped during the day: the call read higher in the morning, the put higher after lunch. That is not a volatility view. It is the formula assuming a different underlying level from the one the options were priced on, which is the same gap Section 3 showed in the auction.
After 14:32 it got worse. For 52 of the remaining minutes before the settlement, the put's price was below the lowest value the screen formula will accept, so it returned no IV at all. That is why the put line simply stops.
The bottom panel shows the call-minus-put gap for both measures. The ALPresi gap sits on zero apart from a few one-minute blips, where one leg simply had not traded yet. It averaged 0.4 vol points across the same hours, on the same prices, at the same strike.
This is the easiest audit you can run on any options screen. Pull up the call IV and the put IV at the at-the-money strike, at the same moment. If they differ by more than a fraction of a point, the screen is not reading the market correctly. And any ATM IV built by averaging those two numbers inherits the error.
5. What a trader should take from this
On expiry afternoons, ignore expiring-contract ATM IV. After about 14:30 on expiry day, it tells you more about the formula than about the market. Readings of 40%, 60% or more in the final hour are routine, and they carry no information about tomorrow's volatility.
Be suspicious of any IV that moves while the index is frozen. Between 15:15 and the settlement print, an IV computed off the index level is working from a stale input. If your screen's IV jumps in that window, ask what it is anchored to.
Run the call/put test. One strike, one expiry, one minute: one IV. A screen that shows two different numbers is showing you its own error.
Ask what your IV history is made of. Some platforms store daily IV from feeds like the one above. If so, a single afternoon print of 57% or 150% can end up in the history. There it quietly distorts every IV Rank and IV Percentile computed afterwards. We look at exactly that in our companion piece on IV Rank.
A stable number on a stable day is a feature. The ALPresi measure moved within a three-vol range all session, on a day when NIFTY traded a 193-point range and closed near its open. That is what a volatility measure should do on a day like today.
6. The bottom line
Today's expiry was calm. NIFTY opened at 22,708.80, traded between 22,636.85 and 22,829.75, and settled at 22,749.75.
One volatility readout said the market was pricing 57% at 15:20 and 0.4% at 15:28. It gave the call and the put at the same strike IVs six points apart. That readout was not describing the market. It was describing what happens when a textbook formula is fed a contract with minutes left and an index that has stopped printing.
The options were saying something much simpler all day: roughly 15 to 18 percent.
Data: NSE F&O one-minute prices for all NIFTY option strikes, 27 October 2026 (October monthly and 3 November weekly expiries), and one-minute NIFTY index prints. "Typical screen recipe" refers to a generic, widely used construction and not to any specific platform.
This article is for educational and research purposes only. It is not investment advice or a recommendation to buy or sell any security. Options trading involves substantial risk.



0 comments
No comments yet. Start the discussion.
Leave a comment
Your email is required but never shown publicly.