
📊 Delta-Gamma-Theta-Vega Hedging: Managing Spot, Time, and Volatility Risk : The Mathematical Engine Behind Professional Options Trading
Delta-hedging converts directional option risk into a volatility exposure. However, even after neutralizing delta, a portfolio remains exposed to three major sources of profit and loss: the magnitude of underlying moves (gamma), the passage of time (theta), and changes in implied volatility (vega).
In modern professional practice, effective risk management requires going beyond delta-gamma-theta hedging and actively incorporating vega hedging. This article presents a clear, professional framework for understanding these dynamics with supporting Monte Carlo simulations.
1. From Delta to Gamma: Understanding Convexity
A first-order delta approximation treats option price changes as linear. In practice, option prices are convex. This convexity is captured by gamma (Γ).
For a move of size ϵ , the second-order approximation for call price (similarly, we can write put price) is:
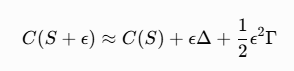
The quadratic term (1/2*ϵ^2*Γ) is the source of gamma risk. Short gamma positions are penalized quadratically by large moves irrespective of direction.
Including time decay, the combined relationship becomes:

2. The Core "Options Trading" Profit Equation
For a delta-hedged short option position, daily P&L is largely determined by Gamma (spot moves), Theta (time decay), and Vega (volatility changes).
Gamma : Short positions suffer quadratically from large price moves.
Theta : Time decay works in favor of the short position.
Vega: Changes in implied volatility significantly impact P&L, even when delta-neutral.

This equation shows that P&L is driven by spot movement (gamma), time decay (theta), changes in implied volatility (vega & vomma), and financing costs as well dividend.
3. Why Vega Hedging Matters: Realized vs. Implied Volatility Regimes
While delta-gamma hedging immunizes a portfolio against directional price action, it leaves the options trader exposed to two distinct, independent dimensions of volatility risk: Realized Variance Risk and Implied Volatility (IV) Surface Risk. Truly effective risk management requires making a sharp structural distinction between these two phenomena:
Realized Volatility # (not equal) Implied Volatility (The Gamma Channel): Realized volatility represents the actual physical path volatility of the underlying asset (Sigma_realized). When an options portfolio is delta-hedged, the physical rate of variance directly dictates the cost or profit of daily rebalancing. If (Sigma_realized > Sigma_implied), a short gamma position will suffer continuous mathematical losses. This is because the actual daily spot movements (Delta S^2) outpace the daily time decay (Theta *Delta_t)) premium collected. This risk enters strictly through the Gamma channel and is driven by the realized asset path, regardless of changes in the option's marked market value.
In a continuous-time framework with a zero risk-free rate and no dividends for simplicity, the instantaneous P&L (as shown below) of a delta-hedged short option position is expressed as:
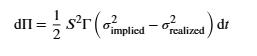
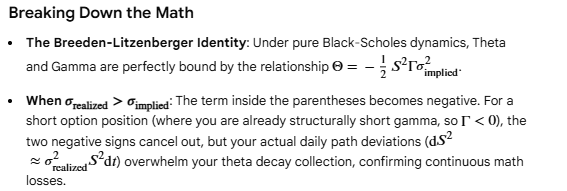
Shifts in the Implied Volatility Surface (The Vega Channel): Implied volatility, on the other hand, represents the forward-looking market price of variance (Sigma_implied). Even if the underlying asset price remains completely stationary (Delta_S = 0), shifts in market supply and demand can cause the entire IV surface to warp or shift higher. A sharp spike in institutional demand for protection can cause the IV of out-of-the-money (OTM) options to surge. This structural repricing directly hits a short position through the Vega channel, generating massive mark-to-market losses.
Vega hedging introduces an offsetting position in secondary option contracts to strictly neutralize this IV surface risk. By matching negative portfolio Vega with positive asset Vega across the term structure, a practitioner ensures that sudden shocks to the market's price of volatility do not cause catastrophic portfolio drawdowns.
4. Framework & Assumptions (Simulating the environment of Delta-Gamma-Theta-Vega Hedging)
All analysis is based on the following standardized setup:
- Underlying Price: Normalized to S0=100
- Option: European ATM Call with strike K=100
- Time to Expiry: 30 days
- Implied Volatility: 20%
- Risk-Free Rate: 5%
- Dividend Yield: 0% (for simplicity)
- Rebalancing: Daily delta hedging
- Simulation Method: Monte Carlo with Geometric Brownian Motion
- Number of Paths: 3,000
Focus: Impact of realized volatility vs. implied volatility, and the value of vega hedging
All simulations assume no transaction costs or market impact, allowing us to isolate the core risk dynamics.
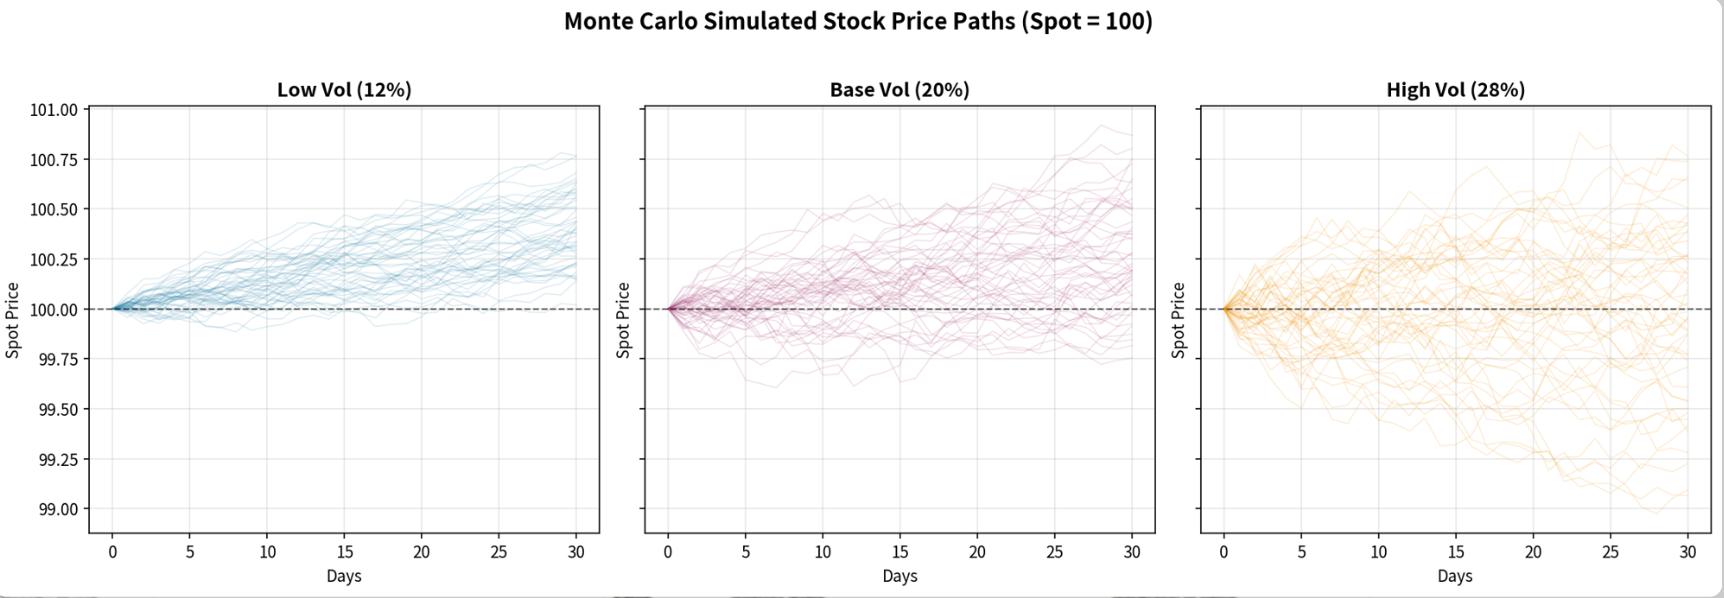
We simulate 3,000 paths of the underlying using Geometric Brownian Motion under three realized volatility regimes while keeping implied volatility fixed at 20%.
Simulated Stock Price Paths (Illustrative)
A typical set of Monte Carlo paths shows:
- Low realized volatility (12%): Paths remain relatively tight around the forward.
- Base case (20%): Moderate dispersion.
- High realized volatility (28%): Paths exhibit significantly larger swings.
These paths are used to compute the daily P&L of a delta-hedged short ATM call.
Simulation Results
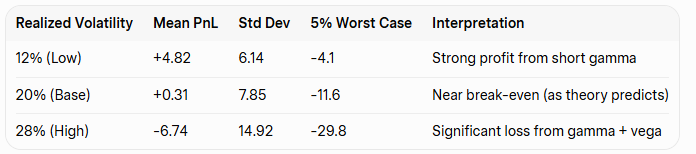
Key Insight: When realized volatility exceeds implied volatility, the short gamma position suffers substantial losses. The distribution of P&L becomes negatively skewed with a heavy left tail.
5. Value of Vega Hedging
We now compare two strategies under the high-volatility scenario (realized vol = 28%):
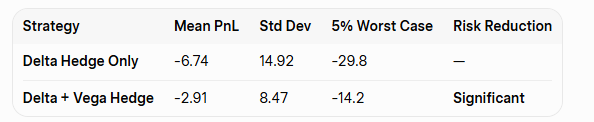
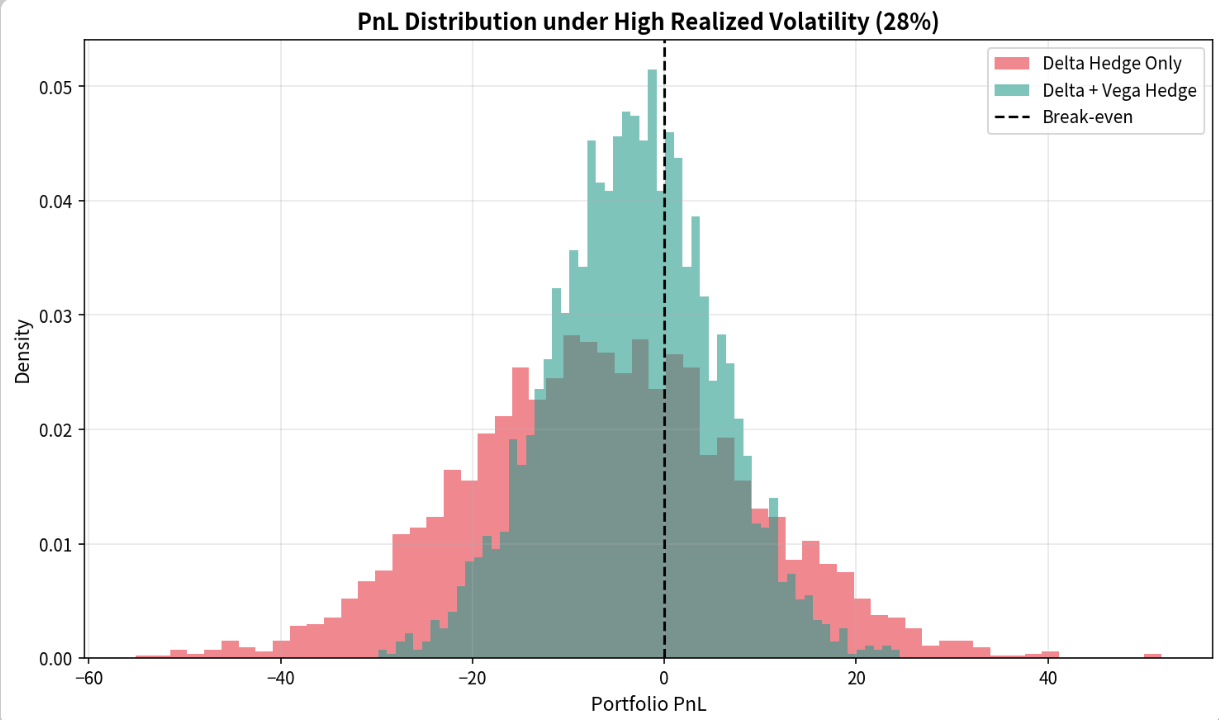
Adding a vega hedge (by purchasing a suitable OTM option) reduces both the average loss and tail risk by approximately 50%. This demonstrates that managing volatility risk alongside gamma risk materially improves the risk profile of the portfolio.
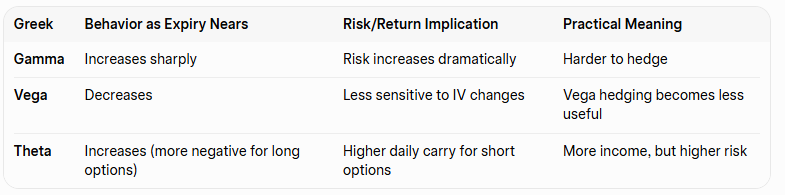
Summary: Greek Behavior as Expiry Approaches
PnL vs Spot Move at Different Days to Expiry
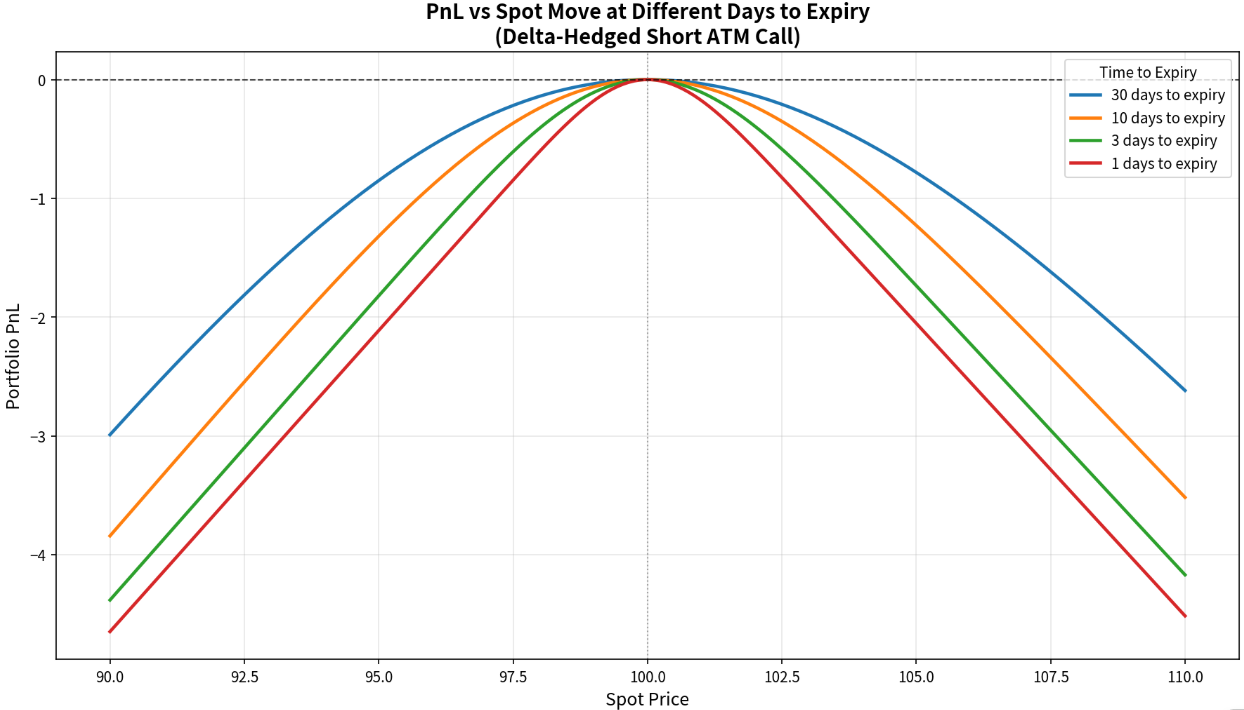
What This Chart Clearly Shows:
- As expiry approaches, the PnL profile of a delta-hedged short option becomes much more sensitive to spot moves.
- Far from expiry, the position behaves more like a short volatility position with moderate risk.
Close to expiry, it behaves like a highly leveraged short gamma position -where even moderate moves in the underlying can lead to large profits or losses.
This chart is very useful for understanding why gamma hedging becomes increasingly difficult and important as expiry nears.
The closer you are to expiry, the more dangerous large spot moves become for a short gamma position — even if you are delta-hedged.
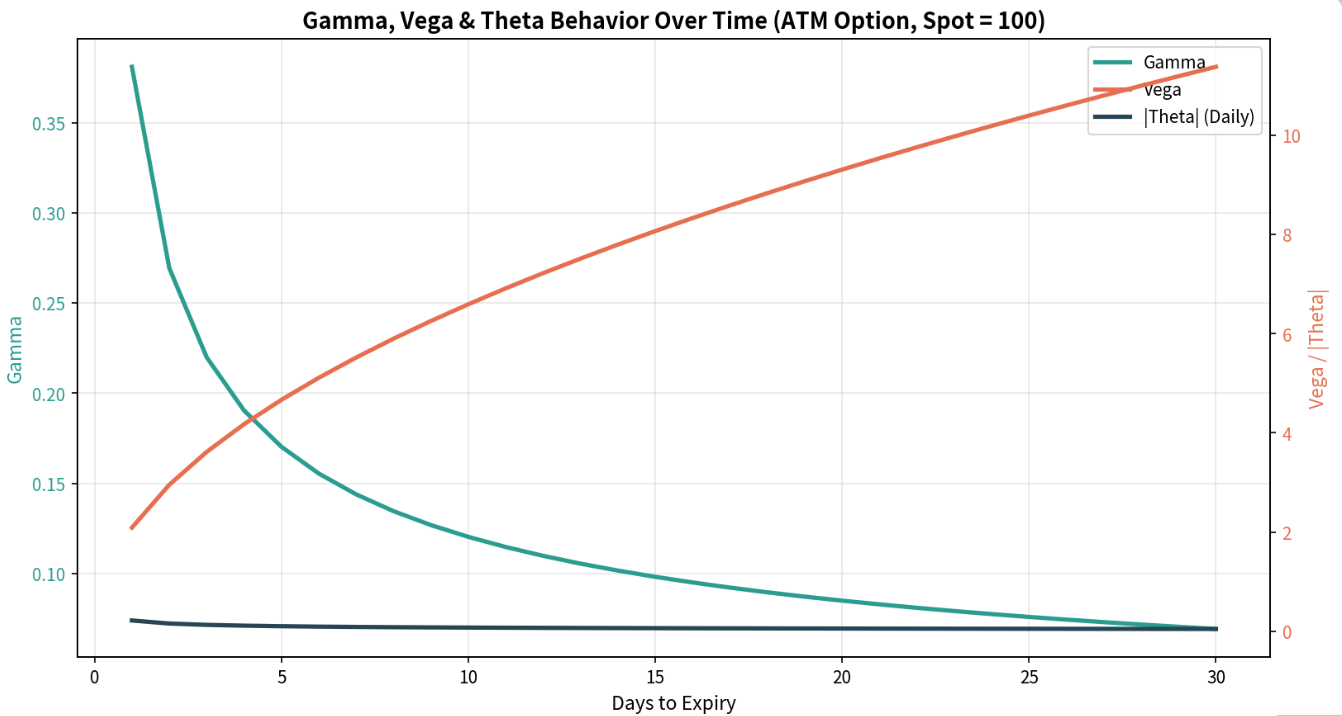
Key Takeaways from the Combined Chart:
- Gamma risk explodes in the final 5–7 days before expiry.
- Vega becomes less relevant as expiry nears (which is why vega hedging is less useful close to expiry).
- Theta increases significantly near expiry-short option positions earn more daily decay, but at the cost of much higher gamma risk.
This single chart nicely summarizes why risk management focus shifts from Vega to Gamma as expiry approaches.
6. Correlation Between Strikes and Structural Basis Risk
Even though all options across a single chain are tethered to the exact same underlying asset, their individual returns are structurally imperfectly correlated. Quantitative modeling demonstrates that the correlation between At-The-Money (ATM) and 10% Out-Of-The-Money (OTM) call options averages 0.74 during stable, regime-normal environments. Crucially, during highly volatile periods, this correlation degrades significantly to 0.61.
This breakdown in cross-strike correlation exposes vega-hedged portfolios to severe basis risk, which can be understood through two competing structural modeling frameworks:
Sticky-Strike Dynamics: This paradigm assumes that an option’s implied volatility is a rigid function of its absolute strike price (K). As the underlying spot price crashes toward an OTM strike, that specific strike retains its elevated skew premium. If the trader hedged an ATM position using an OTM option under a sticky-strike regime, the structural hedge ratio will decouple as the underlying spot moves.
Sticky-Delta Dynamics: This framework assumes that volatility is a function of moneyness (S/K). As the spot price shifts, the skew profile slides along with it. If market makers rapidly re-price the options chain from a sticky-strike to a sticky-delta regime during sudden market stress, the expected hedge ratios can change instantly.
When a trader offsets the Vega of a short ATM position by purchasing a defensive OTM strike, they are not executing a perfect hedge. Instead, they are taking on a complex relative-value trade on the shape of the volatility smile. The sharp decline in correlation during stress events means that the OTM hedge may not expand in value quickly enough to cover the surging liabilities of the short ATM position. This leaves a residual exposure known as volatility skew basis risk.
We can skip Dispersion Trading and Views on Correlation in this blog, will cover separately.
7. Key Professional Takeaways
- Delta-Gamma-Theta hedging is necessary but not sufficient in real markets.
- Vega hedging provides material protection against volatility risk, though it slightly reduces positive theta income.
- Correlation between strikes is imperfect (typically 0.65–0.80) and often declines during stress periods, leaving some residual risk even after vega hedging.
- Advanced strategies such as dispersion trading allow traders to express views on correlation while managing these multi-dimensional risks.
8. Conclusion
Modern professional option trading has evolved from pure Delta-Gamma-Theta hedging to Delta-Gamma-Theta-Vega hedging. While gamma hedging addresses spot risk and theta generates carry, vega hedging is essential to control volatility risk - the dimension that often causes the largest drawdowns in short option portfolios.
A disciplined volatility trader manages all four Greeks in an integrated framework rather than treating them in isolation.
Disclaimer: The content of this post is purely educational and derived from standard textbooks. It does not constitute investment or trading advice, including the buying or selling of indices, in any financial market.
0 comments
No comments yet. Start the discussion.
Leave a comment
Your email is required but never shown publicly.